2023 2nd Quarter Investment Review and Portfolio Changes
In our 2nd Quarter investment update, we’d like to:
- Summarize market activity over the 2nd quarter of 2023
- Review how portfolios are designed to moderate downturns
- Provide various market returns information
In the 2nd quarter, the global stock market delivered a ~6% return, with US stocks benefiting from greater price appreciation for technology companies and particularly companies that stand to gain from advances in artificial intelligence. Concern over the debt ceiling was resolved as Congress approved legislation suspending the debt ceiling in June, eliminating a source of market stress related to the short-term stability of government spending. Valuations for US stocks, as measured by the ratio of stock price to earnings (P/E) have increased above their long-term average, and international stocks remain below their long-term average as inflation abroad remains somewhat elevated despite moderating economic growth.
The US bond index declined ~1% as investors grew slightly less risk-averse as worries over the banking sector and debt ceiling diminished. The change in risk appetite resulted in investors requiring modestly higher yields to own debt, which drove incremental price declines on bonds.
The Consumer Price Index (CPI) at the end of the quarter reflected a ~3% rate of inflation over prices a year ago. Compared to recent years, the lower rate of inflation reflects a more moderate pace of price increases, and a continued trend towards normalization, especially in comparison to the multi-decade peak of ~9% experienced in 2022.
While US inflation has cooled, it remains above the Federal Reserve’s 2% target, as a result, policymakers may continue to keep the Federal Funds Rate at an elevated level (currently ~5%) until inflation returns to target. As rates remain elevated, economic growth may be muted as businesses cannot justify as many investments with a higher cost of capital, and individuals become reluctant to incur relatively higher-cost debt to purchase homes and cars. A greater decline in inflation would benefit the economy and investors as markets price in greater economic growth resulting from the availability of capital at lower interest rates.
How Your Portfolio Is Designed to Manage Downturns
Over the long term, we believe continued consistent investment in markets is the key driver of investor success. Our goal remains to help you stay invested in markets at a level of risk that you can maintain through the market’s constant gyrations and unpredictability. While your portfolio will never sidestep a market downturn, we seek to engage in a variety of practices that we anticipate may benefit clients through downturns.
Rebalancing
We seek to rebalance portfolios when the balance of stocks, bonds, and alternative investments vary meaningfully from our intended levels. During 2022, as equity markets declined, we sought to rebalance portfolios by selling more stable assets such as bonds and alternatives to purchase stocks. In 2023, as stock markets recovered ~23% from the 2022 lows, stocks generally exceeded the intended proportion of your portfolio, and we sought to sell stock to purchase bonds, bringing the portfolio back to the intended level of risk.
Rebalancing During a Downturn

Rebalancing During a Recovery

Theoretical illustration of rebalancing concepts, not a reflection of any account.
Tax-Loss Harvesting
While rebalancing a portfolio through selling equities at a gain would generally result in tax costs, we seek to offset gains through our ongoing tax-loss harvesting efforts, which may result in an accumulation of tax losses without changing the underlying nature of the portfolio.
Tax-Loss Harvesting Example
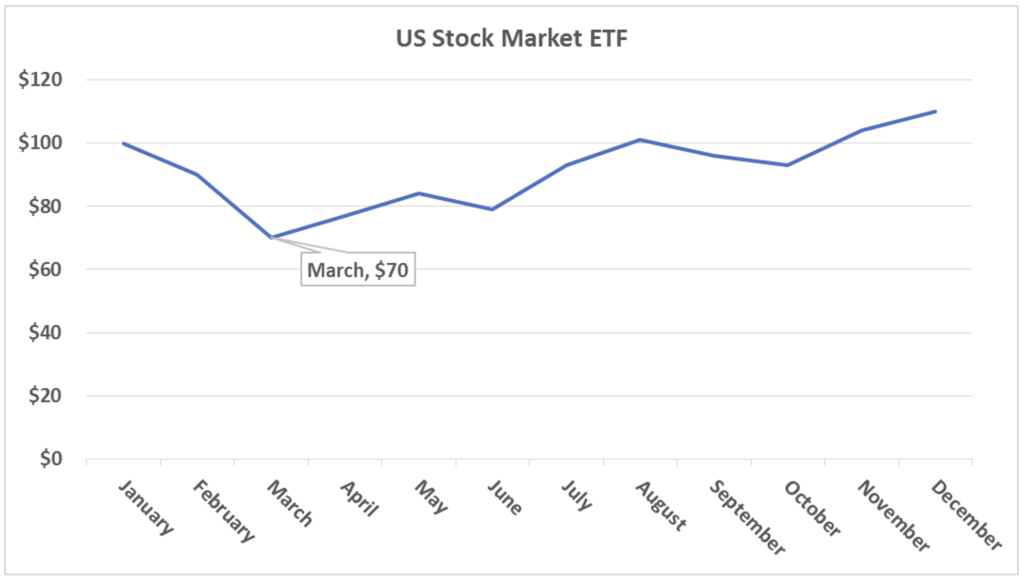
In the illustration below, we demonstrate a theoretical year in which an initial investment in a US stock market ETF is made in January at $100, and the same investment ends the year with a value of $110.
- Throughout the course of the year, the price will fluctuate, allowing the possibility to engage in tax-loss harvesting transactions when the investment is below the purchase price.
- In March, an investor may sell the original investment, such as the Vanguard Total Stock Market ETF, for $70, realizing a $30 loss, but immediately investing the proceeds in a similar investment, such as the iShares Total Stock Market ETF.
- At the end of the year, the investment is at a gain, but a tax loss has been generated.

| |
January |
March |
December |
| Investment Value |
$100 |
$70 |
$110 |
| Economic Gain/Loss |
$0 |
($30) |
$10 |
| Tax: Realized Gain/Loss |
$0 |
($30) |
($30) |
| Tax: Unrealized Gain/Loss |
$0 |
$0 |
$40 |
In this instance, the realized $30 loss can offset gains generated through other means or be retained for use in future years. Since the $40 gain is unrealized, no tax is owed on that gain until the investment is sold.
Years of tax-loss harvesting activity may result in an accumulated tax benefit which can mitigate taxes incurred to rebalance a portfolio during a recovery.
Ownership of US Treasuries
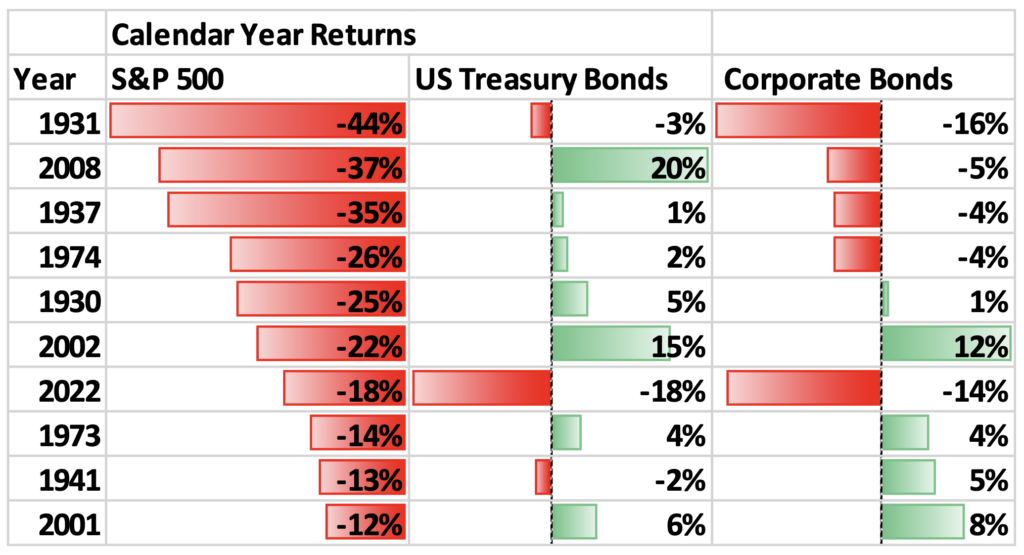
Historically, one of the more stable investments in an economic downturn has been US Treasuries, as investors across the globe seek to place their funds in an asset generally considered to be stable relative to stocks, and the debt or currencies of other governments.
We have incorporated Treasury investments in most client portfolios with the goal of improving stability during stock market downturns – owning relatively stable assets may help to moderate the decline of portfolios during stock market declines and provide a source of funds to purchase equities when they are available to purchase at inexpensive prices.
The below table shows how Treasury bonds and corporate bonds have performed during the 10 worst years for the S&P 500. While the term “Treasury bonds” refers to debt with a term of 10 years or more, the Treasury funds we use generally have an average maturity of ~6 years, which we anticipate would result in smaller swings whether returns are positive or negative.

Data Source: NYU Stern School of Business
Emphasis on “Quality” Stocks
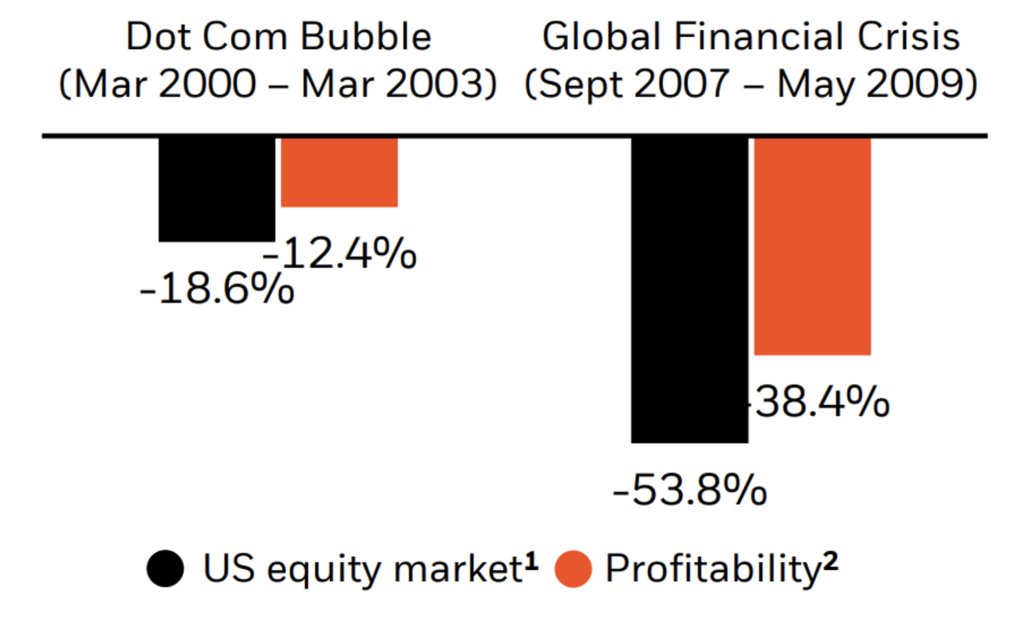
Another component of our investment approach is a systematic, quantitative emphasis on “quality” stocks, which generally refers to companies with higher profit margins, stable earnings growth, and less debt than their peers. Companies with these characteristics have historically shown resilience throughout the business cycle and may particularly benefit when the market as a whole experiences lower profitability and higher borrowing costs.
Annualized Returns During Market Stresses, US Stock Market vs. Quality Index

Source: BlackRock
Market Returns for the 2nd Quarter of 2023
| Market Returns |
Index |
1 Quarter |
1 Year |
3 Years |
10 Years |
| Global Stock Market |
MSCI All Country World Index Net |
6.18% |
16.53% |
11.00% |
8.75% |
| US Bond Market |
Bloomberg US Aggregate |
-0.84% |
-0.94% |
-3.97% |
1.52% |
| US Stock Market |
S&P 500 Composite |
8.74% |
19.59% |
14.61% |
12.86% |
| Inflation |
Consumer Price Index |
0.67% |
2.88% |
5.71% |
2.69% |
| 10-Year Treasury Yield |
3.81% |
Returns as of 6/30/2023, for trailing periods. Returns for periods over one year are annualized.
If you would like to review any aspect of your investments or have any questions regarding this message, please contact us and we would be glad to discuss further.
Thank you,
The Wade Financial Advisory, Inc. Team
Portfolio commentary pertains only to portfolios directly managed by Wade Financial Advisory, Inc. Please reach out to us if you would like to discuss a change in management of any portfolio not directly managed by Wade Financial Advisory, Inc


2023 2nd Quarter Investment Review and Portfolio Changes
Neelesh Champaneri, CFA®, CAIA®
2023 2nd Quarter Investment Review and Portfolio Changes
In our 2nd Quarter investment update, we’d like to:
In the 2nd quarter, the global stock market delivered a ~6% return, with US stocks benefiting from greater price appreciation for technology companies and particularly companies that stand to gain from advances in artificial intelligence. Concern over the debt ceiling was resolved as Congress approved legislation suspending the debt ceiling in June, eliminating a source of market stress related to the short-term stability of government spending. Valuations for US stocks, as measured by the ratio of stock price to earnings (P/E) have increased above their long-term average, and international stocks remain below their long-term average as inflation abroad remains somewhat elevated despite moderating economic growth.
The US bond index declined ~1% as investors grew slightly less risk-averse as worries over the banking sector and debt ceiling diminished. The change in risk appetite resulted in investors requiring modestly higher yields to own debt, which drove incremental price declines on bonds.
The Consumer Price Index (CPI) at the end of the quarter reflected a ~3% rate of inflation over prices a year ago. Compared to recent years, the lower rate of inflation reflects a more moderate pace of price increases, and a continued trend towards normalization, especially in comparison to the multi-decade peak of ~9% experienced in 2022.
While US inflation has cooled, it remains above the Federal Reserve’s 2% target, as a result, policymakers may continue to keep the Federal Funds Rate at an elevated level (currently ~5%) until inflation returns to target. As rates remain elevated, economic growth may be muted as businesses cannot justify as many investments with a higher cost of capital, and individuals become reluctant to incur relatively higher-cost debt to purchase homes and cars. A greater decline in inflation would benefit the economy and investors as markets price in greater economic growth resulting from the availability of capital at lower interest rates.
How Your Portfolio Is Designed to Manage Downturns
Over the long term, we believe continued consistent investment in markets is the key driver of investor success. Our goal remains to help you stay invested in markets at a level of risk that you can maintain through the market’s constant gyrations and unpredictability. While your portfolio will never sidestep a market downturn, we seek to engage in a variety of practices that we anticipate may benefit clients through downturns.
Rebalancing
We seek to rebalance portfolios when the balance of stocks, bonds, and alternative investments vary meaningfully from our intended levels. During 2022, as equity markets declined, we sought to rebalance portfolios by selling more stable assets such as bonds and alternatives to purchase stocks. In 2023, as stock markets recovered ~23% from the 2022 lows, stocks generally exceeded the intended proportion of your portfolio, and we sought to sell stock to purchase bonds, bringing the portfolio back to the intended level of risk.
Rebalancing During a Downturn
Rebalancing During a Recovery
Theoretical illustration of rebalancing concepts, not a reflection of any account.
Tax-Loss Harvesting
While rebalancing a portfolio through selling equities at a gain would generally result in tax costs, we seek to offset gains through our ongoing tax-loss harvesting efforts, which may result in an accumulation of tax losses without changing the underlying nature of the portfolio.
Tax-Loss Harvesting Example
In the illustration below, we demonstrate a theoretical year in which an initial investment in a US stock market ETF is made in January at $100, and the same investment ends the year with a value of $110.
In this instance, the realized $30 loss can offset gains generated through other means or be retained for use in future years. Since the $40 gain is unrealized, no tax is owed on that gain until the investment is sold.
Years of tax-loss harvesting activity may result in an accumulated tax benefit which can mitigate taxes incurred to rebalance a portfolio during a recovery.
Ownership of US Treasuries
Historically, one of the more stable investments in an economic downturn has been US Treasuries, as investors across the globe seek to place their funds in an asset generally considered to be stable relative to stocks, and the debt or currencies of other governments.
We have incorporated Treasury investments in most client portfolios with the goal of improving stability during stock market downturns – owning relatively stable assets may help to moderate the decline of portfolios during stock market declines and provide a source of funds to purchase equities when they are available to purchase at inexpensive prices.
The below table shows how Treasury bonds and corporate bonds have performed during the 10 worst years for the S&P 500. While the term “Treasury bonds” refers to debt with a term of 10 years or more, the Treasury funds we use generally have an average maturity of ~6 years, which we anticipate would result in smaller swings whether returns are positive or negative.
Data Source: NYU Stern School of Business
Emphasis on “Quality” Stocks
Another component of our investment approach is a systematic, quantitative emphasis on “quality” stocks, which generally refers to companies with higher profit margins, stable earnings growth, and less debt than their peers. Companies with these characteristics have historically shown resilience throughout the business cycle and may particularly benefit when the market as a whole experiences lower profitability and higher borrowing costs.
Annualized Returns During Market Stresses, US Stock Market vs. Quality Index
Source: BlackRock
Market Returns for the 2nd Quarter of 2023
Returns as of 6/30/2023, for trailing periods. Returns for periods over one year are annualized.
If you would like to review any aspect of your investments or have any questions regarding this message, please contact us and we would be glad to discuss further.
Thank you,
The Wade Financial Advisory, Inc. Team
Portfolio commentary pertains only to portfolios directly managed by Wade Financial Advisory, Inc. Please reach out to us if you would like to discuss a change in management of any portfolio not directly managed by Wade Financial Advisory, Inc
This communication contains the opinions of Wade Financial Advisory, Inc. about the securities, investments and/or economic subjects discussed as of the date set forth herein. This communication is intended for information purposes only and does not recommend or solicit the purchase or sale of specific securities or investment services. Readers should not infer or assume that any securities, sectors or markets described were or will be profitable or are appropriate to meet the objectives, situation or needs of a particular individual or family, as the implementation of any financial strategy should only be made after consultation with your attorney, tax advisor and investment advisor. All material presented is compiled from sources believed to be reliable, but accuracy or completeness cannot be guaranteed. PAST PERFORMANCE DOES NOT GUARANTEE FUTURE RESULTS. INVESTMENTS BEAR RISK INCLUDING THE POSSIBLE LOSS OF INVESTED PRINCIPAL.
Wade Financial Advisory, Inc. is an investment adviser registered with the Securities and Exchange Commission. Registration of an Investment Advisor does not imply any level of skill or training. A copy of current Form ADV Part 2A is available upon request or at www.advisorinfo.sec.gov. Please contact Wade Financial Advisory, Inc. at (408) 369-7399 with any questions.
Categories
More Articles
Family Foundations vs. Donor-Advised Funds: Choosing the Right Vehicle for Your Philanthropy
Equity Benefits Post-IPO in Tech
Tax Benefits of Philanthropy for High-Net-Worth Individuals
2024 1st Quarter Investment Review and Portfolio Changes
High-Income Family Guide to College Financial Planning
Understanding RSUs, Stock Options, and ESPPs: Insights for Tech Executives in Silicon Valley
There's no time like the present
Contact us today to speak to one of our trusted advisors and learn how our team can partner, educate, and guide you on your path to financial confidence.