portfolio management

2022 3rd Quarter Investment Review and Portfolio Update

In our quarterly investment update, we’d like to:

  • Summarize market activity over the 3rd quarter of 2022
  • Discuss the importance of a consistent investment process
  • Provide various market returns information

Market Summary for the 3rd Quarter of 2022

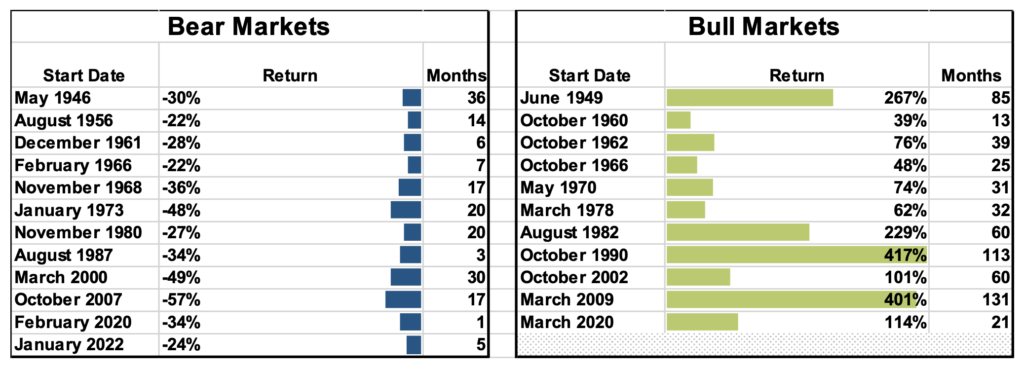
Global equity markets declined ~6% in the third quarter, remaining in a bear market.  Over the same timeframe, the US bond index declined by ~5%, as rising interest rates reduced the value of bonds.  Another impact of rising interest rates in the US has been a strengthening of the dollar relative to other currencies over the course of the year, with the Euro, British pound, and Japanese yen declining ~13%, ~16%, and ~20%, respectively.

As stock markets decline in value, they become cheaper relative to their fundamental characteristics.  As an example, the S&P 500 was priced at a multiple of ~21x earnings at the start of the year, and ~15x at the end of the quarter.  While prices have declined, earnings continue to rise, albeit less rapidly than in years past, as estimates for S&P 500 earnings for the calendar year 2022 are still expected to be 10% above the prior year.

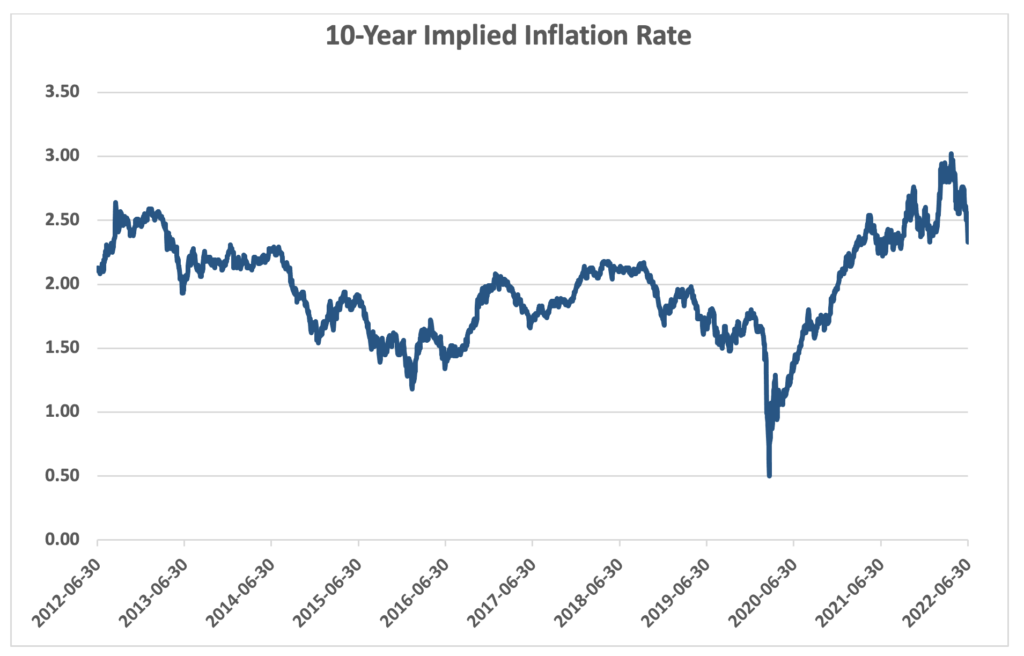
For bonds, the 10-year Treasury, which is commonly used as a reference point for bond yields, started the year with a yield of ~1.5% and rose to a ~4% yield at the end of the quarter, which translates into a higher yield collected by the investor.

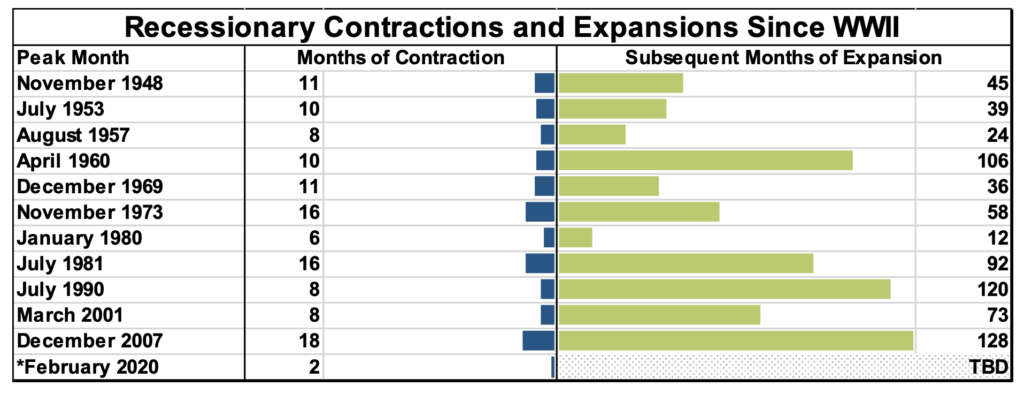
As the Federal Reserve continues to increase interest rates with the intention to moderate inflation, the impact of more expensive borrowing is felt across the economy as a constraint on growth.  Traditionally, labor markets are directly impacted by these less expansive policies, and at quarter-end, unemployment has remained particularly low at ~3.7%.  As we start from a very low level of unemployment, the peak unemployment of a potential recession may be lower than prior recent recessions, softening the impact on the economy and potentially providing for a quicker recovery as the often lengthy and expensive process of reconnecting workers to new, post-recession jobs may impact a smaller proportion of the overall labor force.

The Importance of a Consistent Investment Process

An important characteristic of our approach to investing is our use of a strategic investment approach versus a tactical approach.  We would describe a strategic approach to investing as one that is consistent over time, with outcomes-driven primarily by the broadest risk and return characteristics of the stock, bond, and alternative investment markets.  In contrast, a tactical allocation approach relies on making changes to the investments in a portfolio in a relatively rapid fashion in response to market news, typically with substantial changes to both the level of stock or bond investment, and the specific stocks and bonds held.

The goal of tactical asset allocation is to add value through big changes to the underlying investments, while with strategic investment, we focus on matters such as cost-effectiveness, tax efficiency, and determining which types of assets to own over the long-term, such as including private debt, real estate, and other investments in the portfolio.

During periods of market declines, clients might ask whether we are making big shifts to the portfolio to avoid a downturn.  Because these types of big shifts are error-prone, tax-inefficient, and tend to detract from long-term returns, we avoid making them.

The chart below shows the returns and risk (as measured by annual standard deviation, which is a representation of volatility) of fund category averages for consistent investment approaches grouped by their level of stock investment, and the average for funds in the tactical asset allocation category.  As we would expect, the long-term returns for consistent investment approaches increase in risk and return as the level of stock investment increases.  However, the tactical asset allocation category has a return below the 50-70% stock category, while delivering a similar level of risk.  This indicates that the efforts to dramatically shift investments to generate an additional return and moderate risk actually achieve the opposite outcome.  Further, the heightened level of buying and selling generates a significant tax cost, as demonstrated by the average after-tax return of the tactical asset allocation category falling further down the graph.

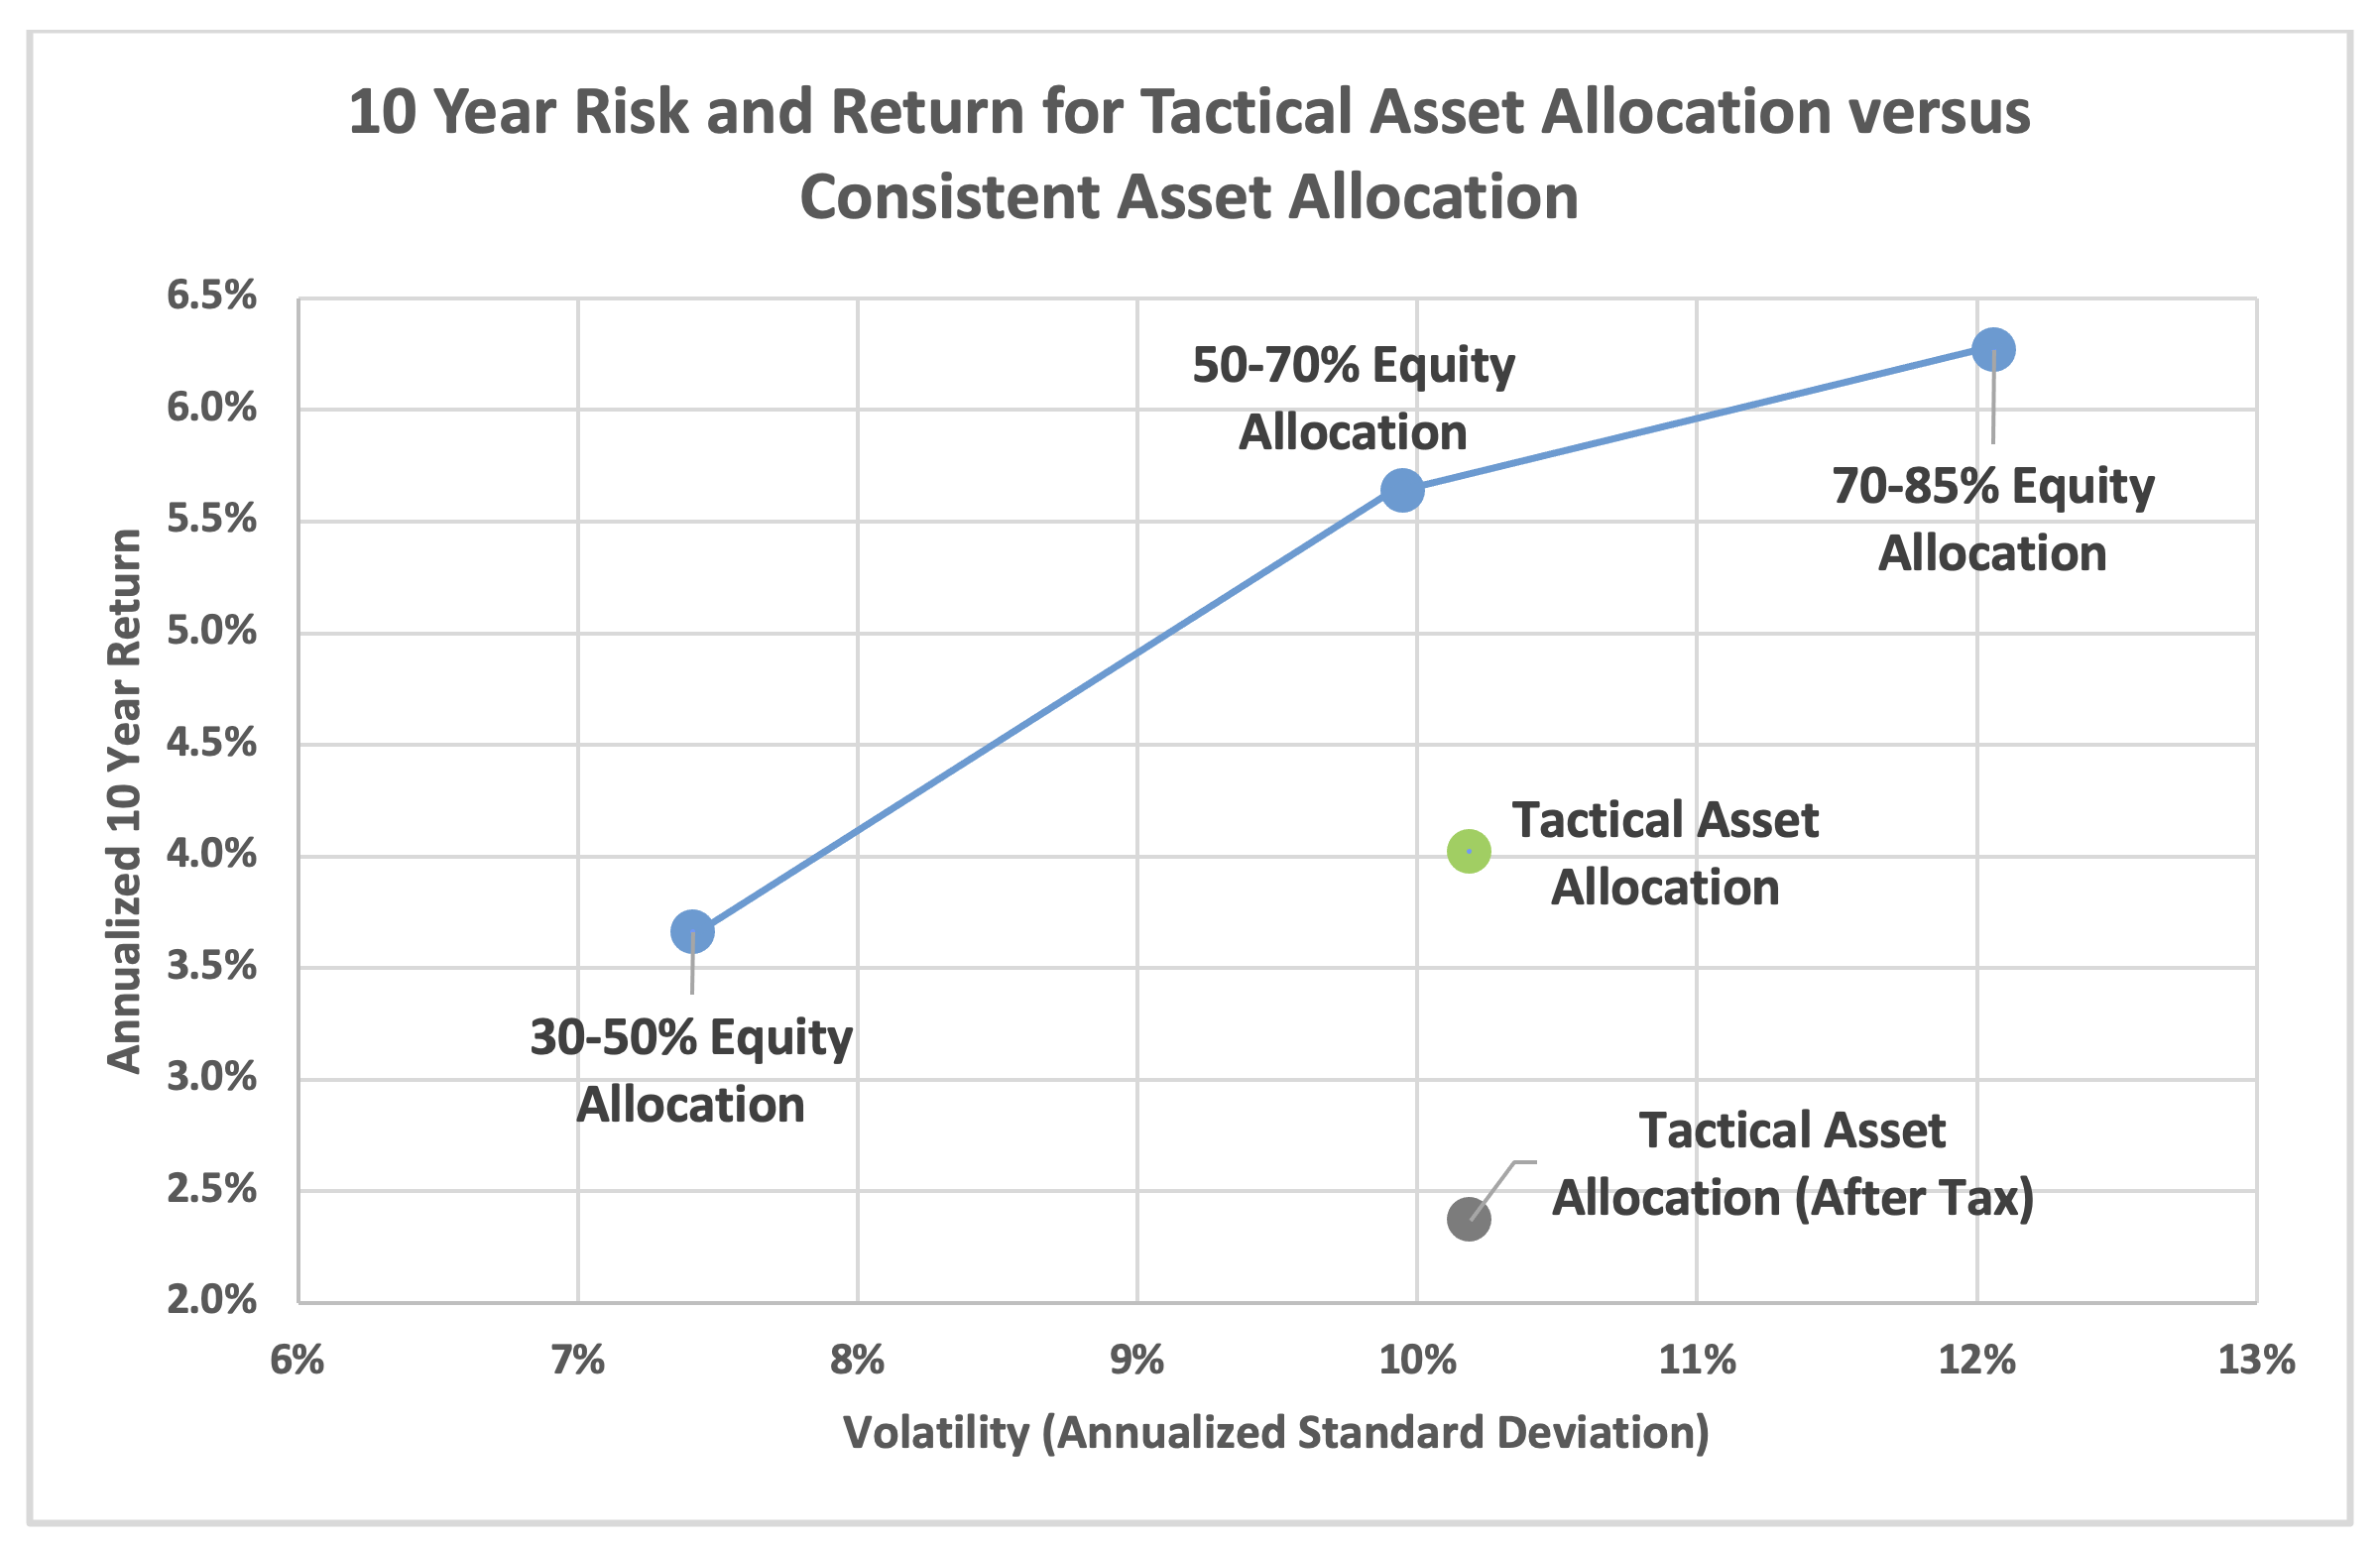
Data Source:  Morningstar

To demonstrate how the tactical asset allocation approach can be very error-prone, the following chart displays data points for each tactical allocation fund, with each fund’s performance relative to peers indicated by a percentile ranking (1st percentile being the best performance, and 100th percentile being the worst).  These percentile rankings are measured for a 5-year period on the y-axis, and for the year-to-date on the x-axis.  If there were results to the tactical allocation approach, we would expect to see a relationship between the long-term performance rankings for a fund and performance rankings in the current year.  As it turns out, there is essentially no relationship between the two, suggesting that luck plays a great part in outcomes for tactical allocation.  This can be observed by the cloud of data points below, versus a consistent line relating greater long-term return rankings to greater recent return rankings.  For those interested in math, the 5-year return ranking explains just 3% of the year-to-date return ranking (when applying linear regression).

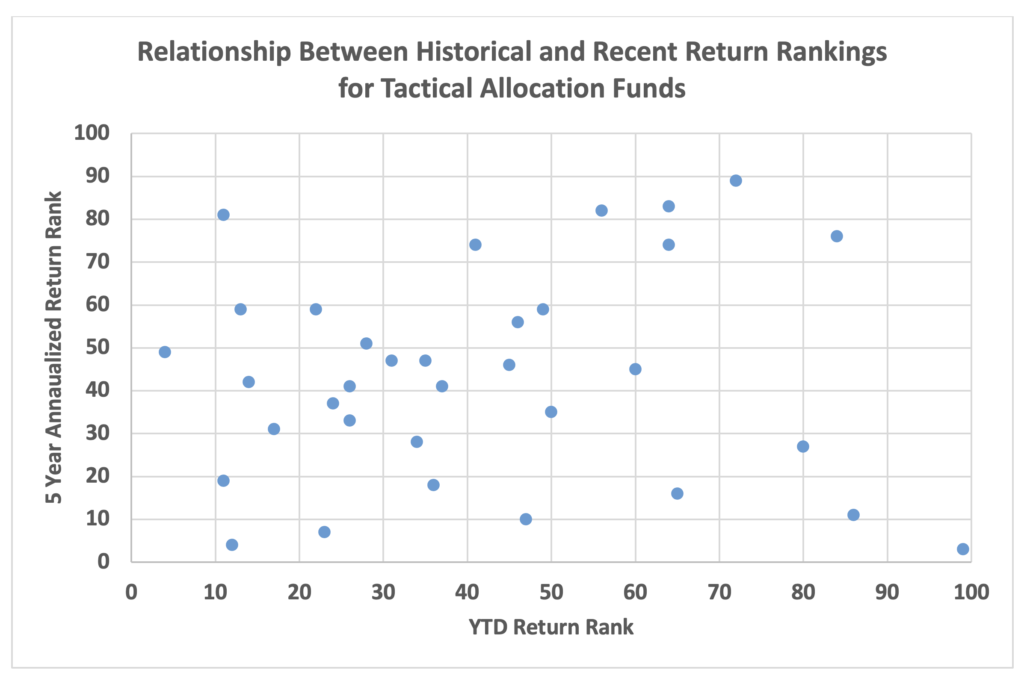
Data displayed for funds with over $100M in assets and 5-year return history. 
Data source:  Morningstar

Instead of seeking to add value through typical tactical allocation approaches, we look to participate in market returns for the long term and focus our efforts on areas that we consider highly like to add value over time, such as generating tax benefits through tax-loss harvesting, rebalancing the portfolio to remain at a consistent risk level, and determining which assets to include in the portfolio for the long run.

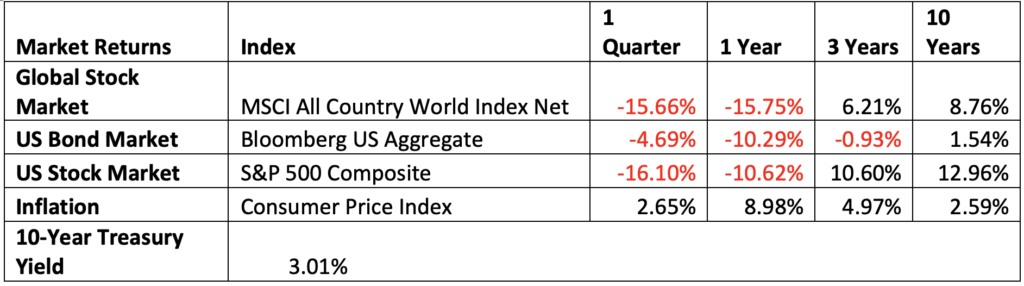
Market Summary for the 3rd quarter of 2022

Market Returns Index 1 Quarter 1 Year 3 Years 10 Years
Global Stock Market MSCI All Country World Index Net -6.82% -20.66% 3.75% 7.28%
US Bond Market Bloomberg US Aggregate -4.75% -14.60% -3.25% 0.89%
US Stock Market S&P 500 Composite -4.88% -15.47% 8.16% 11.71%
Inflation Consumer Price Index 0.10% 7.84% 4.86% 2.48%
10-Year Treasury Yield 3.83%

Returns as of 9/30/2022, for trailing periods.  Returns for periods over one year are annualized.

If you would like to review any aspect of your investments or have any questions regarding this message, please contact us and we would be glad to discuss further.

Thank you,

The Wade Financial Advisory, Inc. Team

Portfolio commentary pertains only to portfolios directly managed by Wade Financial Advisory, Inc.  Please reach out to us if you would like to discuss a change in management of any portfolio not directly managed by Wade Financial Advisory, Inc.

This communication contains the opinions of Wade Financial Advisory, Inc. about the securities, investments and/or economic subjects discussed as of the date set forth herein. This communication is intended for information purposes only and does not recommend or solicit the purchase or sale of specific securities or investment services. Readers should not infer or assume that any securities, sectors or markets described were or will be profitable or are appropriate to meet the objectives, situation or needs of a particular individual or family, as the implementation of any financial strategy should only be made after consultation with your attorney, tax advisor and investment advisor. All material presented is compiled from sources believed to be reliable, but accuracy or completeness cannot be guaranteed. PAST PERFORMANCE DOES NOT GUARANTEE FUTURE RESULTS. INVESTMENTS BEAR RISK INCLUDING THE POSSIBLE LOSS OF INVESTED PRINCIPAL.

Wade Financial Advisory, Inc. is an investment adviser registered with the Securities and Exchange Commission. Registration of an Investment Advisor does not imply any level of skill or training. A copy of current Form ADV Part 2A is available upon request or at www.advisorinfo.sec.gov. Please contact Wade Financial Advisory, Inc. at (408) 369-7399 with any questions.

2022 3rd Quarter Investment Review and Portfolio Update Read More »

2022 2nd Quarter Investment Review and Portfolio Update

In our quarterly investment update, we’d like to:

  •  Summarize market activity over the 2nd quarter of 2022
  •  Discuss recessionary headlines and how it relates to your portfolio
  • Provide various market returns information

Market Summary for the 2nd quarter of 2022

Global equity markets declined ~15% in the second quarter and entered into a bear market, characterized by a decline of 20% or more from peak values.  Inflationary pressures have created concerns that the Federal Reserve may need to increase short-term interest rates above 3% to combat inflation, as raising the cost of funds for consumption and investment can discourage the growth in demand for goods and services, reducing imbalances between demand and supply that drives inflation.  The potential for reduced demand dampens expectations for economic growth, while higher interest rates reduce the present value of companies’ future earnings – both of these factors contribute to declines for the stock market.

For traditional bond investments, increases in both inflation expectations and interest rates negatively impact the value of bonds, resulting in a decline in value for the Bloomberg US Aggregate Bond Index of ~4.7% for the quarter, and ~10% over four quarters.

Inflation rose to 9.1% in June as measured by the Consumer Price Index, reaching a multi-decade high.  While short-term inflation is at a 40-year high, market expectations for inflation over the coming decade is closer to 3% annualized, as expressed by market price differences for US Treasuries offered with and without inflation adjustments.  These expectations are shown in the chart below, which indicates that long-term inflation expectations at present are consistent with the 2-3% range observed in years past.

Data Source: Federal Reserve Bank of St. Louis
The breakeven inflation rate represents a measure of expected inflation derived from 10-Year Treasury Constant Maturity Securities (BC_10YEAR) and 10-Year Treasury Inflation-Indexed Constant Maturity Securities (TC_10YEAR). The latest value implies what market participants expect inflation to be in the next 10 years, on average.

Differentiated investments including private debt and alternative investments generally had favorable performance, with the majority of strategies employed outperforming a traditional stock and bond index approach in the second quarter.  We consider investments in private real estate, infrastructure assets, farmland, and timber to provide the potential to offset inflation risks within a diversified portfolio.

As client portfolios have participated in the losses experienced in broad markets, we seek to continue executing our processes to generate benefits where possible through tax-loss harvesting and rebalancing across asset classes to keep portfolios in line with their intended parameters.  In practice, this generally has resulted in trimming back better performing alternative investments and private debt to purchase equities and conservative bonds.  As a reminder, tax-loss harvesting is the process of selling an investment at a loss and replacing it with similar investment, for the purpose of accelerating tax benefits and deferring tax liabilities, without changing the overall characteristics of your portfolio.

Recessionary Headlines and Your Portfolio

Financial news in recent months has been dominated by talk of a potential recession, with some considering a recession a near certainty, while others dismiss the possibility outright.  We don’t think it is realistic to have so much certainty in one outcome or the other, as a wide range of outcomes are possible, which is generally the case for any financial forecast.

To address the question of how a recession is defined, while it is commonly associated with two-quarters of declining GDP growth, US recessions are labeled by the NBER (National Bureau of Economic Research) Business Cycle Dating Committee, which looks for a significant decline in economic activity that is spread across the economy and lasts more than a few months.  Three main criteria must be met:

  1. Depth – is the decline significant?
  2. Duration – does the decline last more than a few months?
  3. Diffusion – is the impact broadly felt across the economy?

Recessions can be categorized into three major groups:

  • Structural recessions, like the global financial crisis of 2008-2009
  • Event-driven recessions, like the pandemic recession of 2020
  • Cyclical recessions, which we last experienced in 2001

While structural recessions are the most severe and long-lasting as they require significant changes to the economy to correct past errors, such as the high leverage and speculation of global financial crisis, they tend to be very infrequent as the magnitude of issues that cause them rarely occur.

Event-driven recessions, as the name implies, are caused by a single event, typically a shock to the economy, and tend to be short-lived, although impacts can be mild to severe.  These are the rarest forms of recessions.

Cyclical recessions tend to be mild to moderate events and are the most common type.  A cyclical recession is typically brought on by expansive elements of the economic cycle reaching an excess and then being curtailed through a naturally occurring reduction in demand or government policies to constrain demand through higher borrowing costs (monetary policy), or reduced government spending (fiscal policy) – monetary policy is the most common tool employed to reduce excess demand and inflation.

The chart below displays the length of recessions after World War II, and the much longer expansionary periods after each recession.

Data Source: National Bureau of Economic Research

While recessionary periods are meaningful, they do not perfectly align with stock market declines, as the stock market represents current expectations for future economic conditions.  Stock markets typically decline in advance of a recession, and often begin their recoveries while the economy is still in the midst of a recession when peak pessimism induced by the recent past turns to optimism over initial indicators of a return to growth.

The US stock market as represented by the S&P 500 has already experienced a decline of ~24% since reaching a peak value in January, in anticipation of the possibility of a recession.  If we anticipate a ~35% decline associated with moderate cyclical recessions, the market has already priced in much of the potential loss.  We don’t consider it appropriate to make big changes to the level of stock investment in response to a market decline, as these types of market timing decisions create the risk of missing out on future stock market gains.

Data Source: FactSet, NBER, Robert Shiller, Standard & Poor’s, J.P. Morgan Asset Management.

A bear market is defined as a 20% or more decline from the previous market high. The related market return is the peak to trough return over the cycle. Bear and bull returns are price returns.

Your portfolio is designed with consideration for both good and poor markets, and with thought given to the impact of interest rates, inflation, recessionary risk, and the general growth that economies and stock markets tend to enjoy over longer time periods.  While it can be uncomfortable to see your portfolio decline in value, we consider participating in losses to be the necessary price of enjoying the long-term gains of stock market investment.

In recent years, we have made adjustments to reduce portfolios’ negative impacts from rising interest rates.  For clients that utilize illiquid investments, we have added investments such as private real estate and real assets that can benefit from an inflationary environment, balancing the risks to the portfolio overall.

Within stock investments, one component of our approach is the use of “quality” stock investments through ETFs which emphasize companies with high-profit margins, stable earnings growth and lower debt levels than their peers.  While these investments will lose value in a recession and in the current bear market, they have the potential to modestly outperform the market if profitability and the cost of debt become greater challenges for the stock market as a whole.

While your portfolio has not dramatically shifted in composition, we consider your portfolio to be well-positioned to participate in long-term growth while diversifying and moderating the risks it is exposed to.  We will continue to monitor the investments used within your portfolio and perform the tax-loss harvesting and rebalancing activities that we anticipate can generate meaningful value during a downturn.

Market Summary for the 2nd quarter of 2022

Returns as of 6/30/2022, for trailing periods.  Returns for periods over one year are annualized.

If you would like to review any aspect of your investments or have any questions regarding this message, please contact us and we would be glad to discuss further.

Thank you,

The Wade Financial Advisory, Inc. Team

Portfolio commentary pertains only to portfolios directly managed by Wade Financial Advisory, Inc.  Please reach out to us if you would like to discuss a change in management of any portfolio not directly managed by Wade Financial Advisory, Inc.

2022 2nd Quarter Investment Review and Portfolio Update Read More »

Q2 2021 QMR

2021 2nd Quarter Investment Review and Portfolio Update

In our quarterly investment update, we’d like to:

  • Summarize market activity over the 2nd quarter of 2021
  • Discuss portfolio changes to incorporate additional private debt investments
  • Provide various market returns information

Market Summary for the 2nd quarter of 2021

Global equity markets advanced ~7% in the second quarter as economies continue to recover from the peak economic impact of the pandemic.  The Labor Department reported a record number of job openings and declining jobless claims for the quarter. As an increase in infection rates raised concern about the future pace of reopening, the largest and most profitable businesses fared the best in stock markets relative to economically sensitive companies that often trade at a discount.  International equity markets participated in the stock market rally with ~6% growth, as vaccination availability advanced in developed countries, particularly in Europe.

U.S. bond markets performed well in the quarter as foreign demand for Treasuries brought yields on the 10-year Treasury note to their lowest point since March of 2020, finishing the quarter at 1.45%.  Municipal bonds fared well as the growth in economic activity, federal spending plans, and potential tax increases drove a greater investor appetite for tax-exempt bonds issued by state and local governments that are on sounder financial footing than a year ago.

Relative to the ~2% inflation experienced over the last decade, recent inflation measures have been higher, at ~5% as measured by the Consumer Price Index.  While this number is large, there is good reason to not extrapolate that rate of inflation into the far future.  Prices relative to the prior year show high percentage increases largely because the prices of many goods and services fell sharply in the initial months of the pandemic, and now become the comparison point for price levels.

Certain goods also experienced pandemic-driven supply constraints such as semiconductors and lumber, with the associated costs flowing through to the consumer products that need these inputs.  As production capacity is brought back for temporarily constrained semiconductor facilities, sawmills, and other goods, we may have good reason to expect inflation to come closer to the long-term average of ~2%, as illustrated by the breakdown of inflation drivers shown below.

chart 1

As we look ahead, we anticipate the long-term benefits of investing in a diversified portfolio at an appropriate level of risk provides the potential to generate returns in excess of inflation, and help achieve our clients’ goals.  We acknowledge that matters including rising coronavirus cases, changes to fiscal and tax policy, and increasing valuations in stock and bond markets contribute to near-term uncertainty.

For long-term investors, we anticipate that the economic impact of the pandemic will diminish in the years ahead, particularly as vaccine availability increases globally.  While changes in political leadership often drive conversations around policy changes, the laws that eventually pass are often the product of compromise and less onerous than initial proposals.  As stock prices rise, we anticipate earnings will continue to grow over time and provide support for higher prices, as has been the case when looking at longer periods of stock market history.  For bond investors, we position portfolios to have relatively greater ownership of debt investments with favorable yields or lower sensitivity to interest rates, which we anticipate will moderate the susceptibility to rising interest rates and modestly higher inflation.

Portfolio Changes to Incorporate Additional Private Debt Investments

As part of our continuous process to evaluate investment opportunities and existing investments within portfolios we are incorporating a new investment, the Cliffwater Corporate Lending Fund, for clients utilizing illiquid interval fund investments (which are investments that cannot be bought or sold on a daily basis but offer quarterly redemption opportunities).  The Cliffwater fund holds a portfolio of over $2 billion of loans made to thousands of privately held businesses, typically with earnings in the range of ~$75M, across a wide variety of industries.  Sample borrowers within the portfolio are DoorDash and TopGolf, which are larger, better-known businesses than the average borrower, which would be represented by everyday firms such as Marquee Dental, a network of Southeastern dental practices, or Fleetwash, a semi-truck and trailer cleaning business.  As yields on public high-yield bonds have declined from the very favorable rates available a year ago, and yields on conservative bonds remain in the 1-2% range, we find private debt investments, and the Cliffwater fund specifically, attractive for several reasons detailed below.

  • Relatively Higher Yields

As we have experienced with our other private debt investment, the Variant Alternative Income Fund, private debt funds have the potential to provide yields above public markets.  At present, the Cliffwater fund provides a yield of ~7%, while publicly traded high yield bonds yield ~4%, and high quality corporate bonds yield ~2%.  Private debt can offer a higher yield for several reasons:

  1. Borrowers are smaller than large well-known corporations that can issue billions of dollars of bonds in public markets at low rates.
  2. Loans can typically be arranged in under two months, versus a longer and more expensive process of issuing public debt, and borrowers are generally willing to pay a premium for faster funding.
  3. Investors require a yield premium for owning debt that is not publicly traded
  • Floating Rate Loans

While most bond investments offer fixed payments, corporate loans are generally issued on a floating rate basis (also referred to as a variable rate), which allows investors to benefit in the event of rising interest rates, as changes in interest rates are passed on the borrower.  For a bond with fixed payments, rising interest rates can diminish the value of an existing bond.

  • Greater Participation In A Diversifying Asset Class

Within private debt markets, investors in the Variant Alternative Income fund already participate in a broad array of diversifying debt investments (primarily within the “enhanced” categories shown on the left below).  Adding the Cliffwater fund to our portfolios allows us to complement our existing private debt investments with participation in the corporate direct lending market, which is one of the largest and most established segments of private debt.

1 For illustrative purposes only. The chart only is intended to identify the subsectors within the Private Credit opportunity set.

  • Attractive Cost Structure

As with all of our investments, we are focused on ensuring that we utilize cost-effective and competitively priced holdings.  With the Cliffwater fund, we have selected a partner that primarily works with endowments and pension funds, and offers their fund at attractive prices to organizations like WFA that can satisfy the $10 million minimum investment and then make the fund available to clients in amounts appropriate for their portfolio.

Due to the institutional nature of the Cliffwater organization, we are able to access and pass on substantial cost savings to our clients by investing in the Cliffwater Corporate Lending Fund (CCLFX), relative to the methods typically used by investors to access private loans:  Publicly traded business development corporations (BDCs), and private funds which are generally structured as limited partnerships and charge both asset-based fees and performance fees.  The Cliffwater fund avoids performance-based fees and is available at a low fee level for the asset class as illustrated below.

Fees shown include management fees, administrative fees, and performance or incentive fees.

For clients utilizing illiquid investments, the Cliffwater purchase will be funded by lowering our intended level of investment in conservative US bonds, publicly-traded high-yield bonds, and global bonds.  Our overall intended level of bond investments will remain unchanged.

Market Summary for the 2nd quarter of 2021

Market Returns Index 1 Quarter 1 Year 3 Years 10 Years
Global Stock Market MSCI All Country World Index Net 7.39% 39.27% 14.56% 9.90%
US Bond Market Bloomberg Barclays US Aggregate 1.83% -0.33% 5.34% 3.39%
US Stock Market S&P 500 Composite 8.55% 40.79% 18.67% 14.84%
Inflation Consumer Price Index 2.34% 5.35% 2.60% 1.88%
10-Year Treasury Yield 1.45%
Returns as of 6/30/2021, for trailing periods.  Returns for periods over one year are annualized.

If you would like to review any aspect of your investments or have any questions regarding this message, please contact us and we would be glad to discuss further.

Thank you,

The Wade Financial Advisory, Inc. Team


**Portfolio commentary pertains only to portfolios directly managed by Wade Financial Advisory, Inc.  Please reach out to us if you would like to discuss a change in management of any portfolio not directly managed by Wade Financial Advisory, Inc.**

2021 2nd Quarter Investment Review and Portfolio Update Read More »

market volatility during COVID

Portfolio Change to Balance Market Opportunities and Risks

In recent weeks, stock and bond markets have been turbulent as the current and future impact of the coronavirus is being incorporated into investment markets. With our upcoming quarterly investment update, we will provide a more in-depth update on recent market events.

Market Volatility During COVID-19

As is our practice, we are monitoring portfolios to balance risks and opportunities within markets and make adjustments where appropriate. Over the course of 2020, high yield bonds shifted from paying ~3% above U.S. Treasury debt, to paying ~8% above Treasuries. While we have generally avoided higher risk bonds in recent years due to the low-interest rate premiums relative to the risk taken, the current environment has resulted in these bonds moving from prices in their most expensive quartile relative to the past 20 years, to being priced in the cheapest quartile.

Purchasing high yield bonds at current rates has typically led to favorable outcomes when viewed from a multi-year perspective, as indicated in the chart below. To implement this change, we will transition investments from the Pimco Income fund to the Artisan High Yield fund. The change will primarily take place within bond-oriented portfolios, and for equity-oriented portfolios, we will continue to monitor equities for favorable purchase opportunities.

We welcome the opportunity to answer any questions you may have. Contact us to learn more about how WFA can partner with you to grow and protect your wealth.

Three-Year Average Annualized Returns by Starting Interest Rate Level

Three-Year Average Annualized Returns by Starting Interest Rate Level

Portfolio Change to Balance Market Opportunities and Risks Read More »