In our quarterly investment update, we’d like to:
- Summarize market activity over the 3rd quarter of 2022
- Discuss the importance of a consistent investment process
- Provide various market returns information
Market Summary for the 3rd Quarter of 2022
Global equity markets declined ~6% in the third quarter, remaining in a bear market. Over the same timeframe, the US bond index declined by ~5%, as rising interest rates reduced the value of bonds. Another impact of rising interest rates in the US has been a strengthening of the dollar relative to other currencies over the course of the year, with the Euro, British pound, and Japanese yen declining ~13%, ~16%, and ~20%, respectively.
As stock markets decline in value, they become cheaper relative to their fundamental characteristics. As an example, the S&P 500 was priced at a multiple of ~21x earnings at the start of the year, and ~15x at the end of the quarter. While prices have declined, earnings continue to rise, albeit less rapidly than in years past, as estimates for S&P 500 earnings for the calendar year 2022 are still expected to be 10% above the prior year.
For bonds, the 10-year Treasury, which is commonly used as a reference point for bond yields, started the year with a yield of ~1.5% and rose to a ~4% yield at the end of the quarter, which translates into a higher yield collected by the investor.
As the Federal Reserve continues to increase interest rates with the intention to moderate inflation, the impact of more expensive borrowing is felt across the economy as a constraint on growth. Traditionally, labor markets are directly impacted by these less expansive policies, and at quarter-end, unemployment has remained particularly low at ~3.7%. As we start from a very low level of unemployment, the peak unemployment of a potential recession may be lower than prior recent recessions, softening the impact on the economy and potentially providing for a quicker recovery as the often lengthy and expensive process of reconnecting workers to new, post-recession jobs may impact a smaller proportion of the overall labor force.
The Importance of a Consistent Investment Process
An important characteristic of our approach to investing is our use of a strategic investment approach versus a tactical approach. We would describe a strategic approach to investing as one that is consistent over time, with outcomes-driven primarily by the broadest risk and return characteristics of the stock, bond, and alternative investment markets. In contrast, a tactical allocation approach relies on making changes to the investments in a portfolio in a relatively rapid fashion in response to market news, typically with substantial changes to both the level of stock or bond investment, and the specific stocks and bonds held.
The goal of tactical asset allocation is to add value through big changes to the underlying investments, while with strategic investment, we focus on matters such as cost-effectiveness, tax efficiency, and determining which types of assets to own over the long-term, such as including private debt, real estate, and other investments in the portfolio.
During periods of market declines, clients might ask whether we are making big shifts to the portfolio to avoid a downturn. Because these types of big shifts are error-prone, tax-inefficient, and tend to detract from long-term returns, we avoid making them.
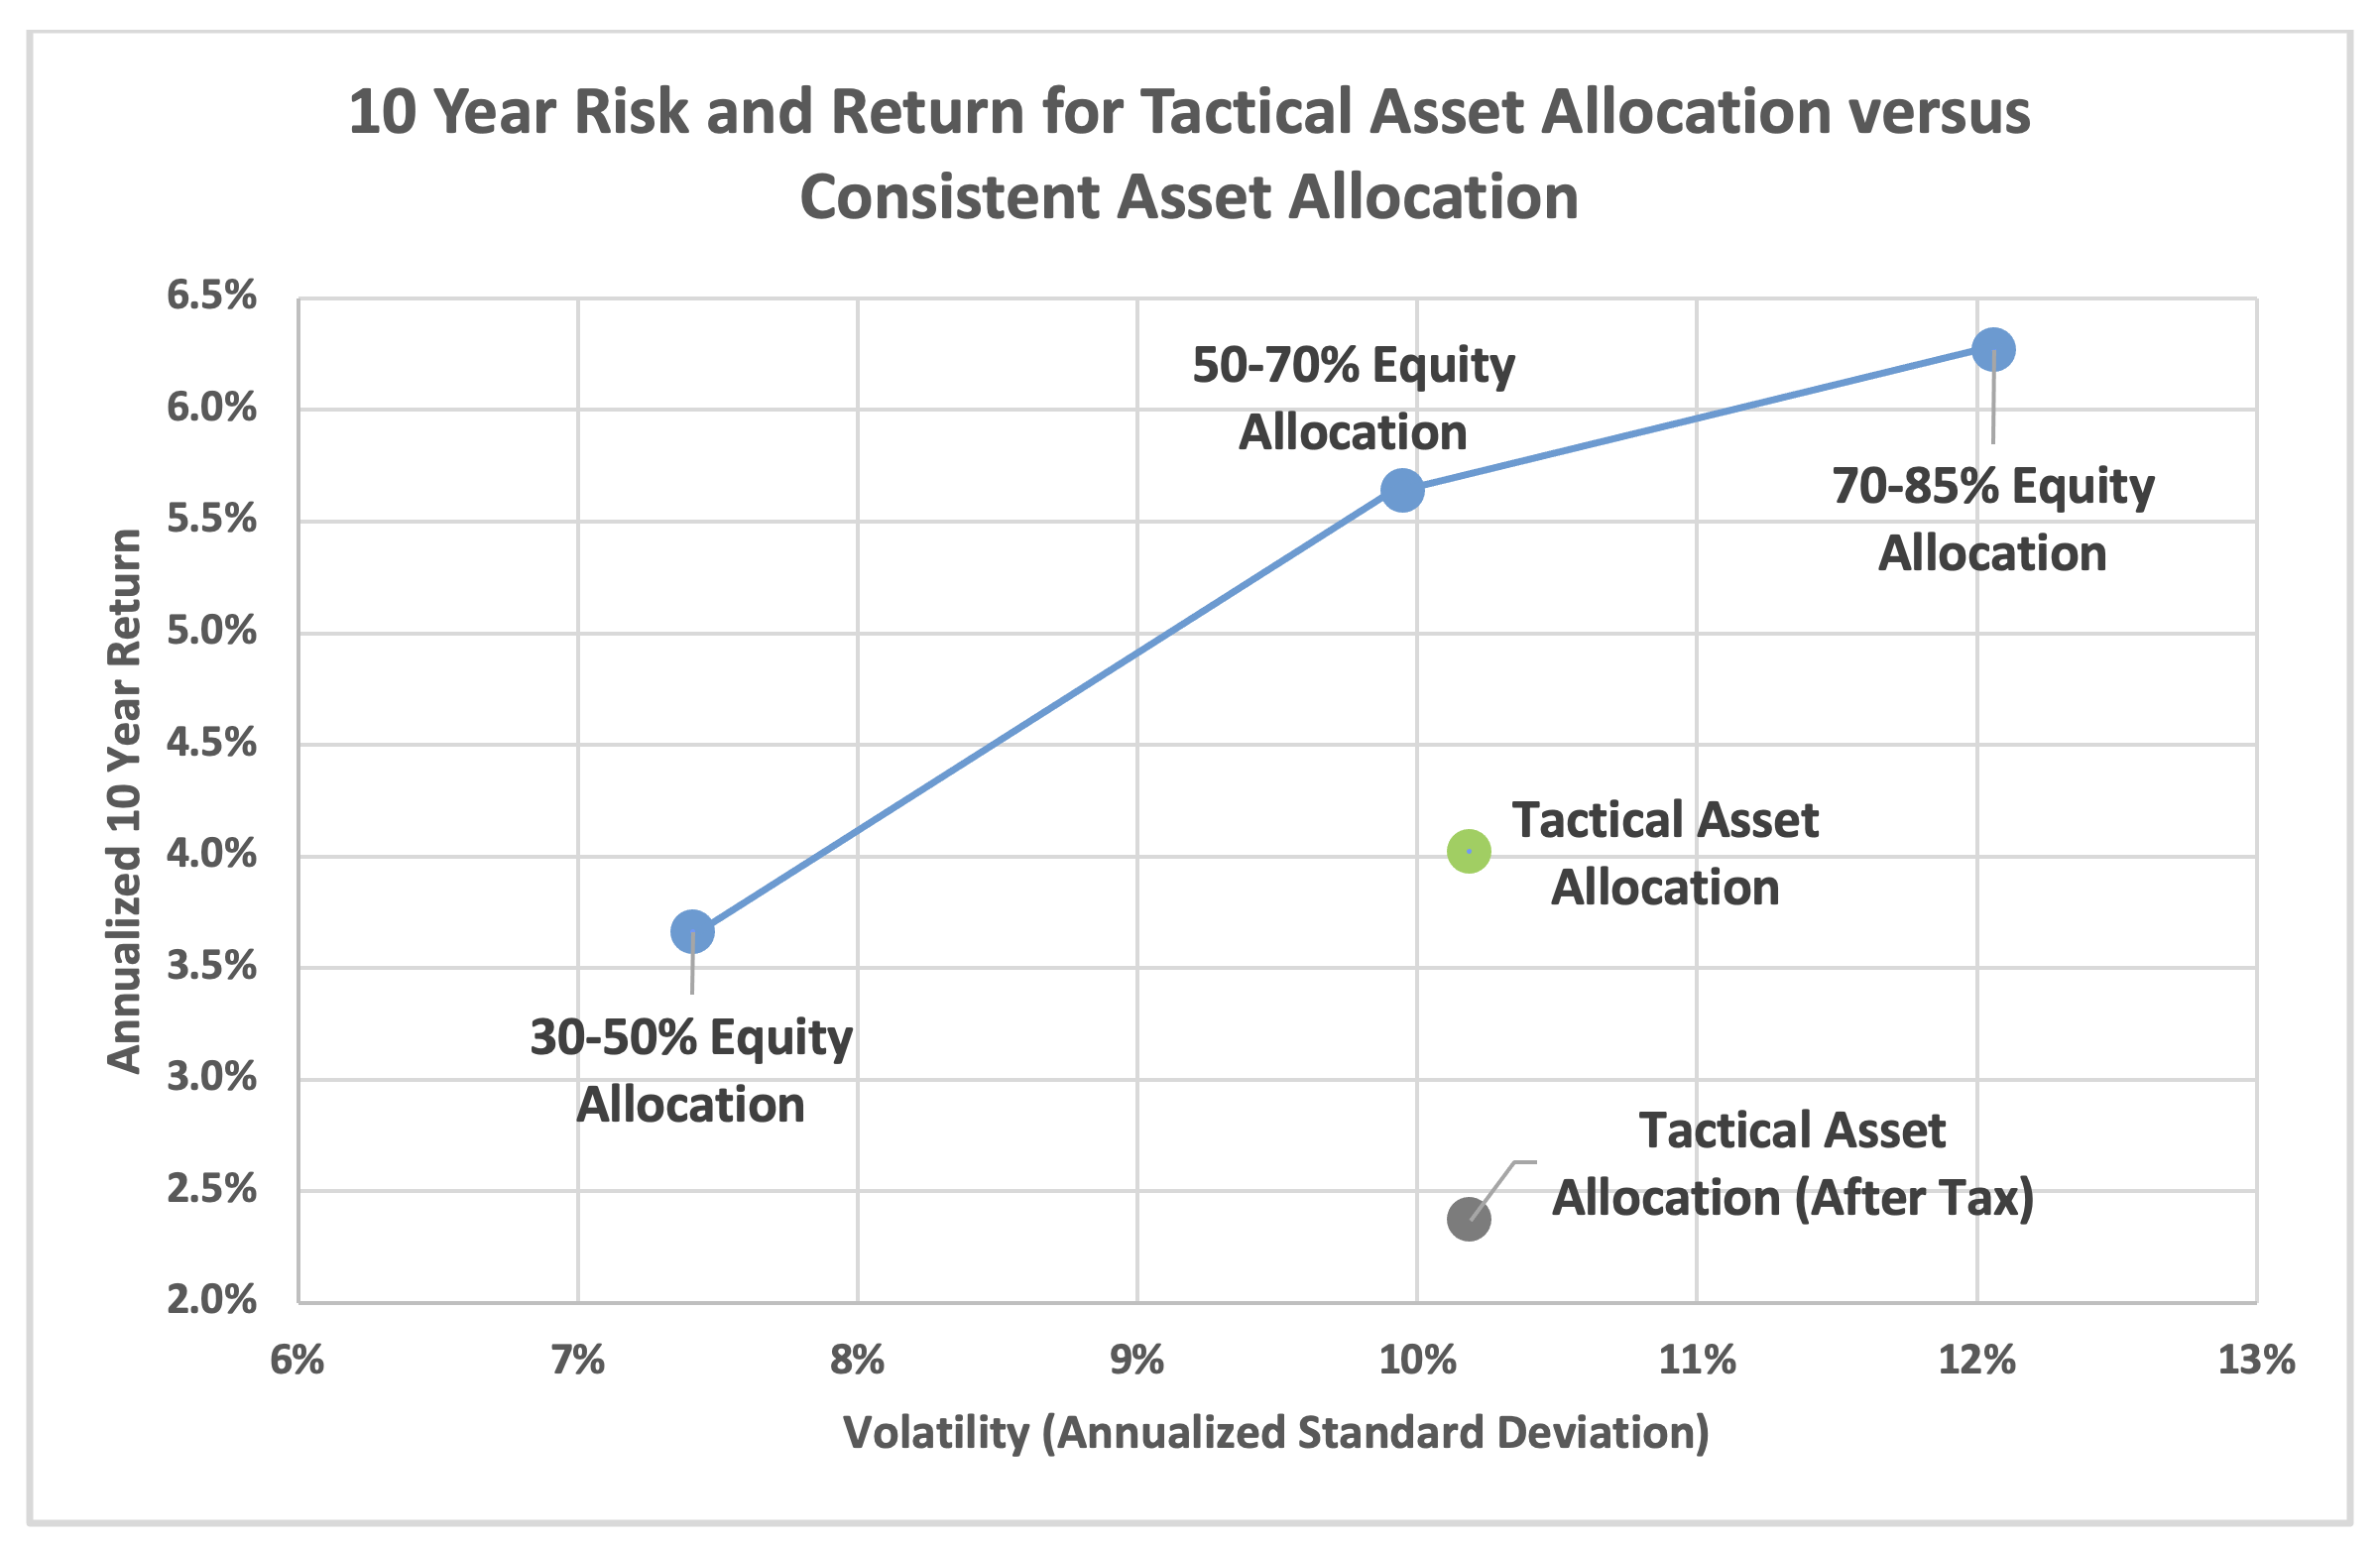
The chart below shows the returns and risk (as measured by annual standard deviation, which is a representation of volatility) of fund category averages for consistent investment approaches grouped by their level of stock investment, and the average for funds in the tactical asset allocation category. As we would expect, the long-term returns for consistent investment approaches increase in risk and return as the level of stock investment increases. However, the tactical asset allocation category has a return below the 50-70% stock category, while delivering a similar level of risk. This indicates that the efforts to dramatically shift investments to generate an additional return and moderate risk actually achieve the opposite outcome. Further, the heightened level of buying and selling generates a significant tax cost, as demonstrated by the average after-tax return of the tactical asset allocation category falling further down the graph.

Data Source: Morningstar
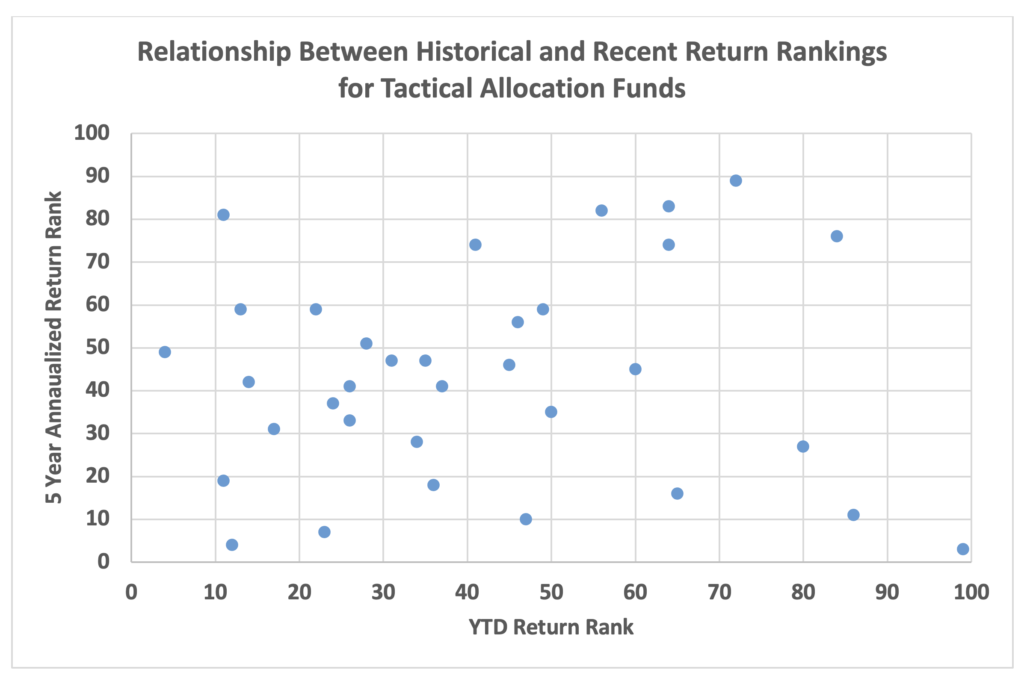
To demonstrate how the tactical asset allocation approach can be very error-prone, the following chart displays data points for each tactical allocation fund, with each fund’s performance relative to peers indicated by a percentile ranking (1st percentile being the best performance, and 100th percentile being the worst). These percentile rankings are measured for a 5-year period on the y-axis, and for the year-to-date on the x-axis. If there were results to the tactical allocation approach, we would expect to see a relationship between the long-term performance rankings for a fund and performance rankings in the current year. As it turns out, there is essentially no relationship between the two, suggesting that luck plays a great part in outcomes for tactical allocation. This can be observed by the cloud of data points below, versus a consistent line relating greater long-term return rankings to greater recent return rankings. For those interested in math, the 5-year return ranking explains just 3% of the year-to-date return ranking (when applying linear regression).

Data displayed for funds with over $100M in assets and 5-year return history.
Data source: Morningstar
Instead of seeking to add value through typical tactical allocation approaches, we look to participate in market returns for the long term and focus our efforts on areas that we consider highly like to add value over time, such as generating tax benefits through tax-loss harvesting, rebalancing the portfolio to remain at a consistent risk level, and determining which assets to include in the portfolio for the long run.
Market Summary for the 3rd quarter of 2022
| Market Returns |
Index |
1 Quarter |
1 Year |
3 Years |
10 Years |
| Global Stock Market |
MSCI All Country World Index Net |
-6.82% |
-20.66% |
3.75% |
7.28% |
| US Bond Market |
Bloomberg US Aggregate |
-4.75% |
-14.60% |
-3.25% |
0.89% |
| US Stock Market |
S&P 500 Composite |
-4.88% |
-15.47% |
8.16% |
11.71% |
| Inflation |
Consumer Price Index |
0.10% |
7.84% |
4.86% |
2.48% |
| 10-Year Treasury Yield |
3.83% |
Returns as of 9/30/2022, for trailing periods. Returns for periods over one year are annualized.
If you would like to review any aspect of your investments or have any questions regarding this message, please contact us and we would be glad to discuss further.
Thank you,
The Wade Financial Advisory, Inc. Team
Portfolio commentary pertains only to portfolios directly managed by Wade Financial Advisory, Inc. Please reach out to us if you would like to discuss a change in management of any portfolio not directly managed by Wade Financial Advisory, Inc.
This communication contains the opinions of Wade Financial Advisory, Inc. about the securities, investments and/or economic subjects discussed as of the date set forth herein. This communication is intended for information purposes only and does not recommend or solicit the purchase or sale of specific securities or investment services. Readers should not infer or assume that any securities, sectors or markets described were or will be profitable or are appropriate to meet the objectives, situation or needs of a particular individual or family, as the implementation of any financial strategy should only be made after consultation with your attorney, tax advisor and investment advisor. All material presented is compiled from sources believed to be reliable, but accuracy or completeness cannot be guaranteed. PAST PERFORMANCE DOES NOT GUARANTEE FUTURE RESULTS. INVESTMENTS BEAR RISK INCLUDING THE POSSIBLE LOSS OF INVESTED PRINCIPAL.
Wade Financial Advisory, Inc. is an investment adviser registered with the Securities and Exchange Commission. Registration of an Investment Advisor does not imply any level of skill or training. A copy of current Form ADV Part 2A is available upon request or at www.advisorinfo.sec.gov. Please contact Wade Financial Advisory, Inc. at (408) 369-7399 with any questions.


